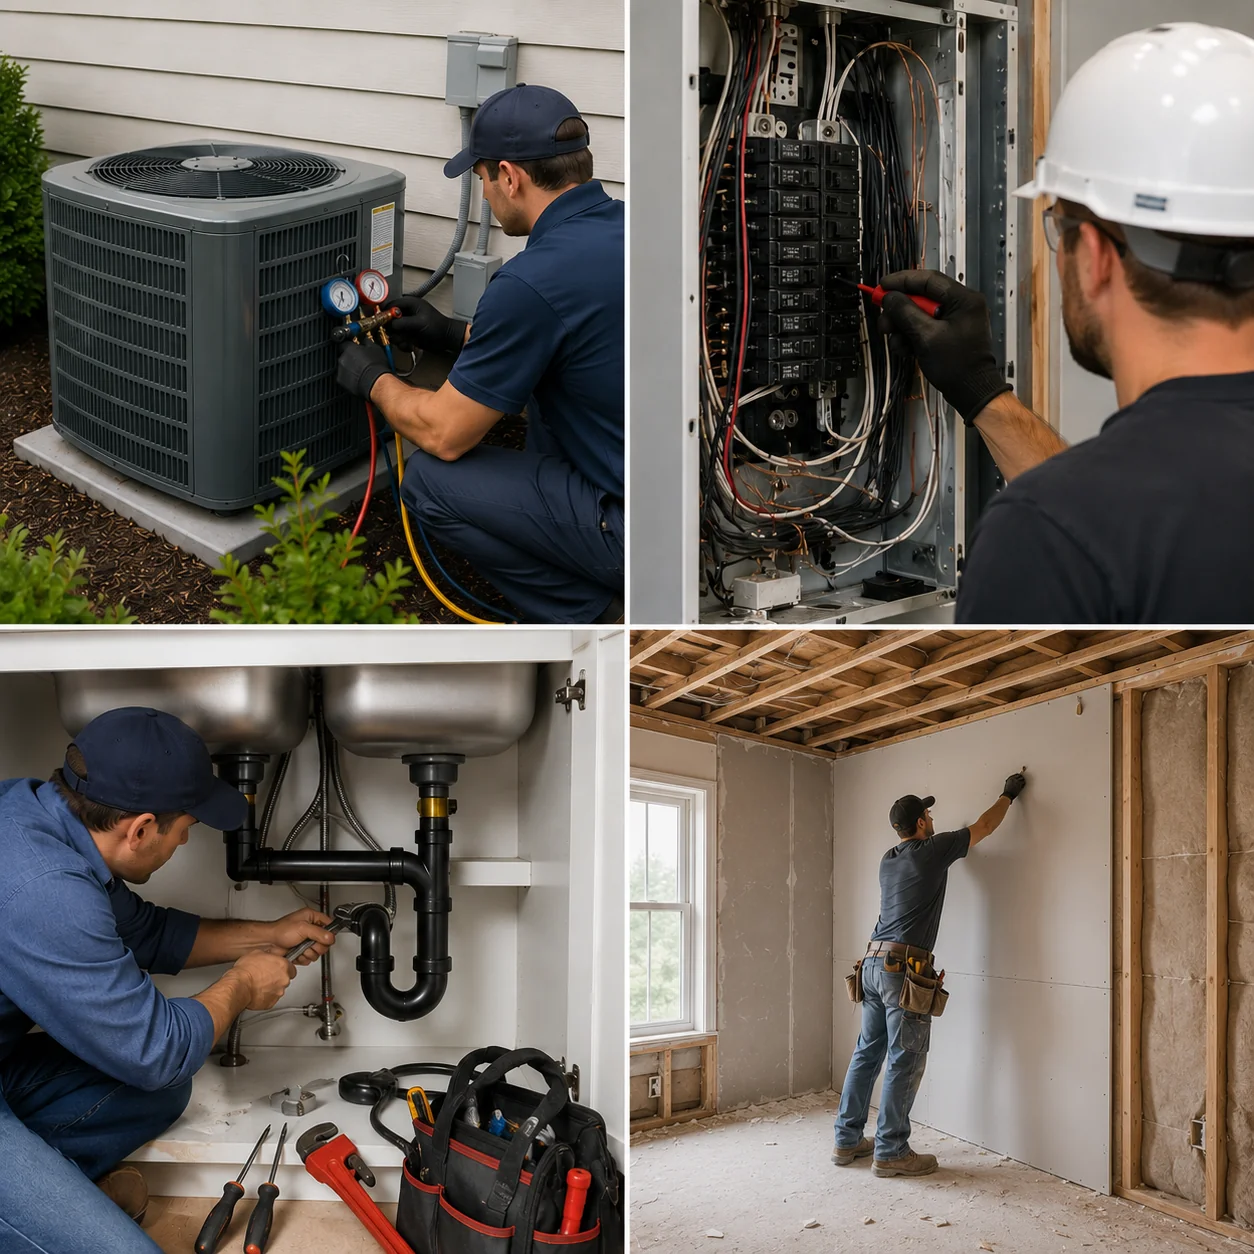
Predictable cash and clear margins for every department.

We help residential trade owners eliminate cash surprises, understand true department and maintenance profitability, and build a company that's stable enough to scale - and sellable when you're ready.

Residential tradesperson working on site
The Questions That Keep You Up

Trucks rolling. Phone ringing. So why is there nothing left in the bank?

"I'm working my butt off, but I don't really know what's making money and what's not."
01

Why am I busy but still broke?

02

Where is my cash actually going?

03

Why is there profit on my P&L but no money in the bank?

04

How much does it really cost to run a truck?

05

Is our maintenance program actually profitable?

06

How do we survive the slow season?

07

Can I afford to hire another tech?

08

Is our pricing wrong by department?

09

Why are my best techs leaving?

10

If I want to sell in 5-10 years, what needs to change now?

The Answers That Put You At Ease

Four systems. Real margins by department.

Not simply bookkeeping, complete financial awareness - CFO-level insight, structured into reporting and models you can act on.

System 01

Cash & Stability

Find out where the cash actually goes, get a forward view of inflows and outflows, and build a plan that carries you through the slow months instead of scrambling.

Cash Flow MapCash ForecastingSlow Season Survival Model
System 02

Margin & Pricing Clarity

Stop guessing with a blended P&L. See true gross margin by department, whether maintenance is carrying its weight, and where your pricing is quietly off.

Department-Level P&LLabor Productivity DashboardMaintenance Profit AnalysisPricing Reality Check
System 03

Capacity & Growth

Know what each tech really generates, the headcount where you break even, and whether you can actually afford the next hire before you make it.

Revenue Per Tech ModelBreak-Even HeadcountHiring Readiness Score
System 04

Owner Wealth & Exit

Pay yourself correctly, see which customers are actually worth keeping, and understand what it takes to make the business sellable when you're ready.

Owner Compensation FrameworkCustomer Profitability RankingSellability Readiness Score

The Math, Not The Accounting

A few points of pricing or efficiency, multiplied by every tech.

If each tech generates around $300k and you're off by just 5% in pricing or efficiency, that's $15k per tech - every year, quietly.

$120k

per year across 8 techs at a 5% pricing-and-efficiency gap. If we fix even part of it, this service pays for itself many times over.

Our Built-to-Last Guarantee

Up to 3 months free
if you haven't gained clarity.

If after 60 days you don't have clear visibility into your department margins and cash position - we'll keep working for free until you do.* You carry none of the risk.

Claim Your Financial Foundation
No long contracts · Cancel anytime · Early wins in the first 30 days